Super Bowl Science Fair 2011 State of the Union Address
GT Project Timeline
| gt_project_timeline_2014-15.pdf |
Be sure to take LOTS OF PICTURES!
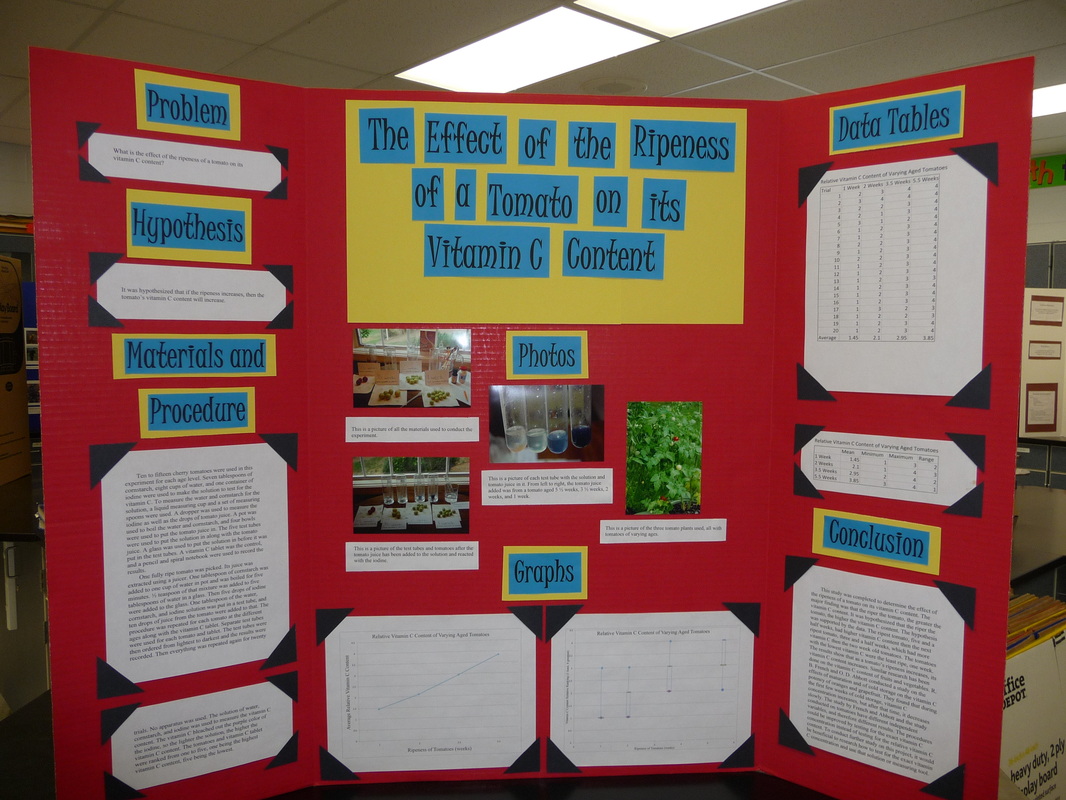
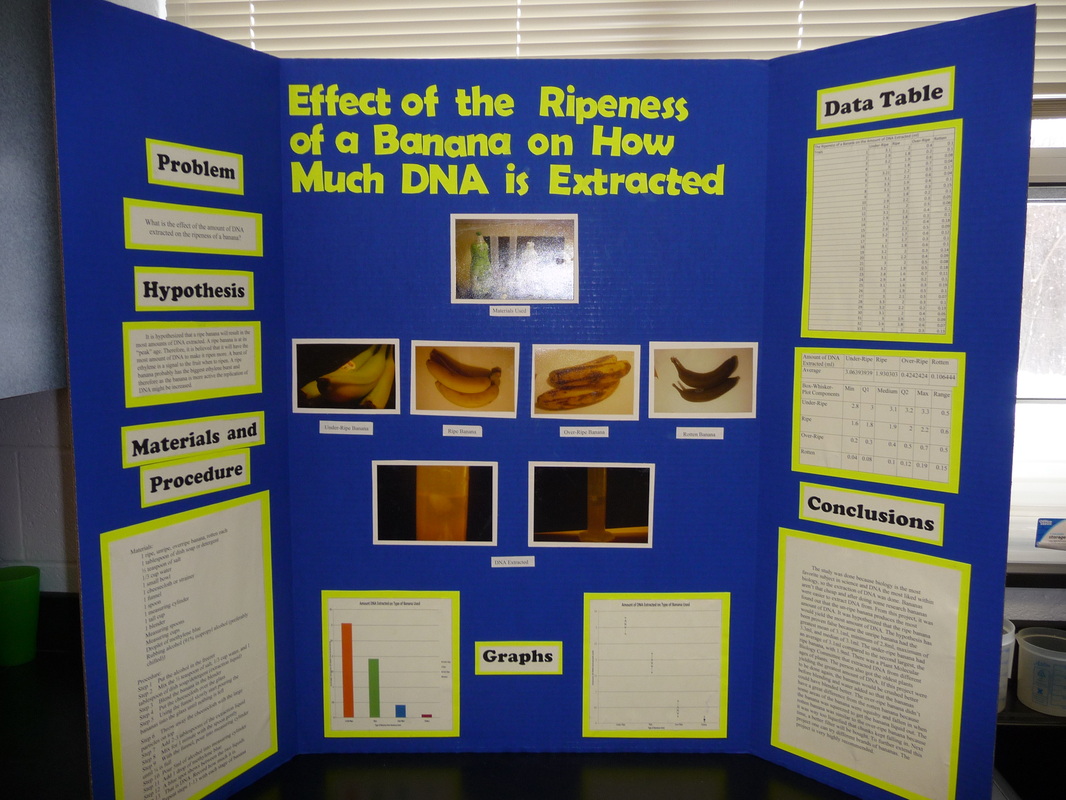
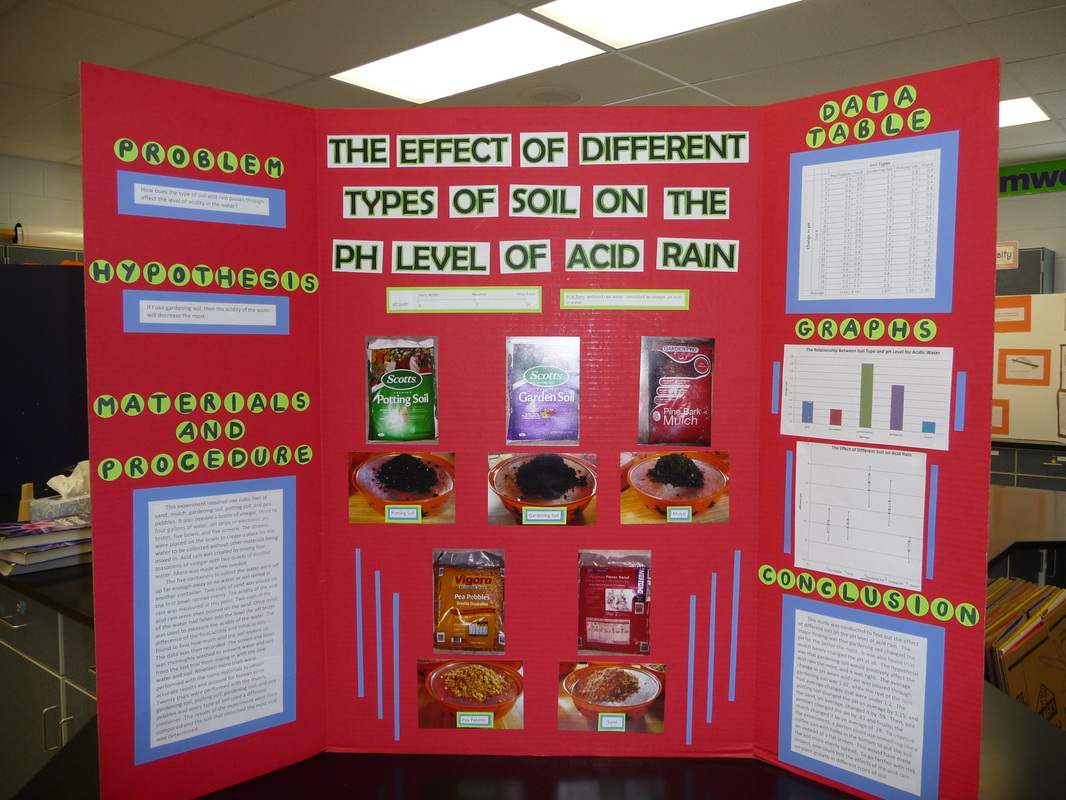
Examples of Materials and Procedure
| mat_pro_1.pdf |
| mat_pro_2.pdf |
| mat_pro_3.pdf |
Results Instruction
Standard Deviation
Definition - it is a measure of how closely the individual data points cluster around the mean. Sort of like Interquartile Range in Box-and-Whisker plot.
To calculate standard deviation on Excel
type =STDEV and highlight your data
To calculate standard deviation on Excel
type =STDEV and highlight your data
T test
Statistical significance is the criterion for the decision that the results of an experiment did not happen by chance but were the result of the treatment.
T test is an inferential statistical test that is used to determine whether significant differences exist between the means of two samples.
T test is done to see if the difference between the two conditions are significant enough to say that your variable had an effect. The two conditions should be control vs. each level of independent variable. Most of you will have 3 t-test p values. One for control and level one of I.V.. Second for control and level two of I.V. etc....
If the t-test p-value is less than .05, then it is significant. If p-value is greater than .05, then the difference is not great enough to say that your I.V. had an effect.
Note. If the t-test p value has a letter "e", this means "times 10 to the ____ power". For example, 6e-8 equals 6 X 10^-8, or 0.00000006
Creating a Box and Whisker Plot on Excel
Note: To find the median, quartiles, etc.. type in the formula in the formula bar as seen in the video below. If the formula bar is missing on YOUR Excel, then click on View tab and select Formula Bar to display it on your screen. Click here to see video in higher resolution.
Click on the image below to zoom in.

Please be aware that the Constructing the Display Board document below has two pages. Also, for your hypothesis, be sure to include the supporting details.
| conclusion_appendix_ackn.pdf |
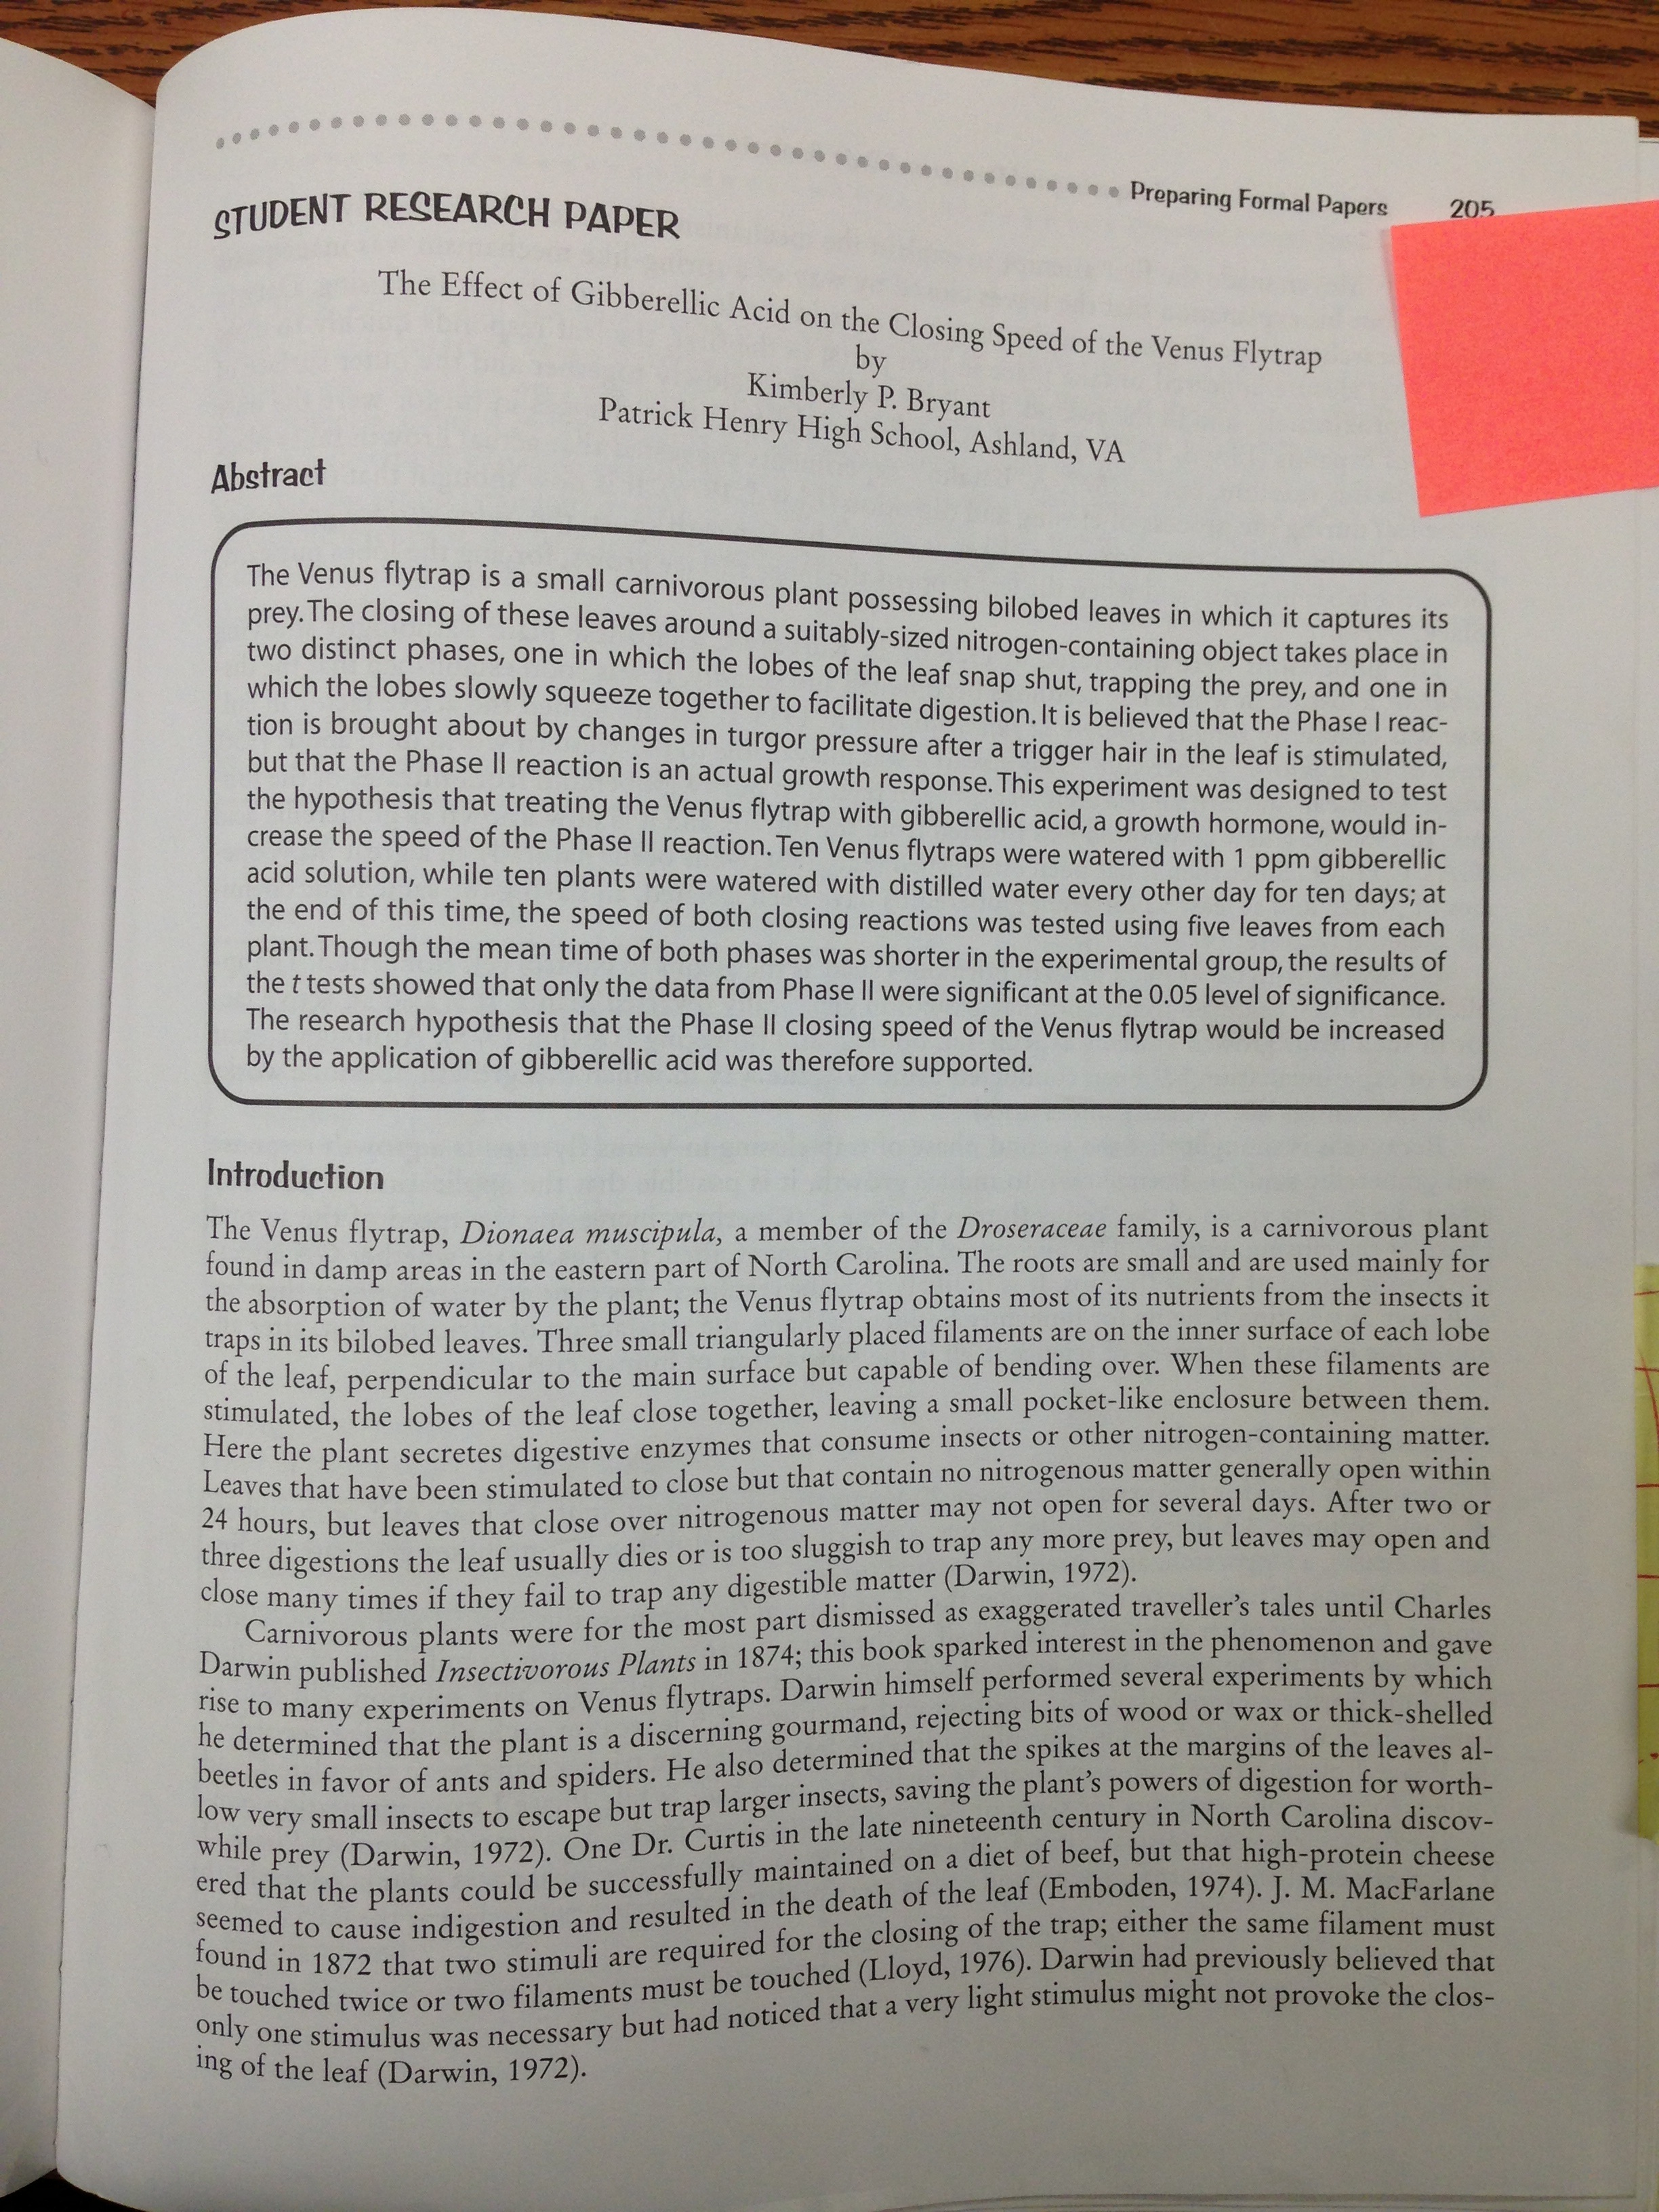
| example_of_abstract.jpg |